How to Debug a White Screen in a Vue 3 App in Production Mode
Today at work, we had a bug pop up for some users experiencing a "white screen of death" when browsing some pages in French.
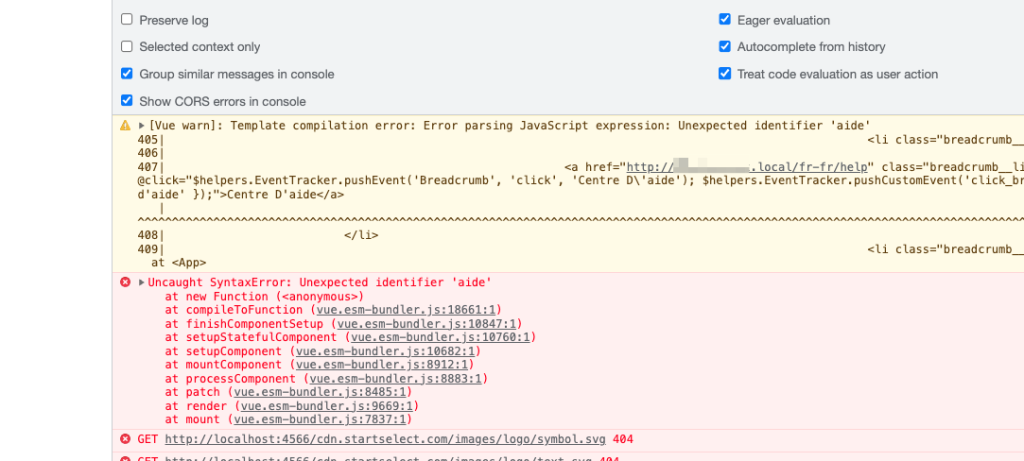
Uncaught SyntaxError: Unexpected identifier 'aide'
    at new Function (<anonymous>)
    at df (vue.esm-bundler.js:18661:21)
    at Fs (vue.esm-bundler.js:10847:36)
    at vue.esm-bundler.js:10760:9
    at Ls (vue.esm-bundler.js:10682:11)
    at I (vue.esm-bundler.js:8912:13)
    at N (vue.esm-bundler.js:8883:17)
    at h (vue.esm-bundler.js:8485:21)
    at Y (vue.esm-bundler.js:9669:13)
    at mount (vue.esm-bundler.js:7837:25)
Yuck! I hate these "Unexpected identifier" errors the most because there is no great way to determine what the surrounding context is.
Due to how we handle infrastructure, it isn't always possible to SSH into the server and recompile the assets with development mode. When running in development mode, you get something like this instead
This would be much better! If you can at all work locally, this is great. Sometimes though, that just isn't possible.
What is happening?
To make a long story short, this usually happens when Vue encounters an exception when trying to compile templates from the browser runtime. If you only use .vue files in your project, you most likely won't run into this specific bug, but if you use Vue in combination with a server framework like Laravel, Django, or Rails, this could happen more often.
When you use Vue in conjunction with these server frameworks, it's possible for Vue to parse the root element of your app at runtime to register things like click handlers and instantiate components. It's this parsing/rendering step that can potentially fail. If the root of your Vue app is an element that wraps everything else on the page, this leaves you with a blank white screen if something goes wrong during rendering.
Enter Devtools
Now, we all know browsers have devtools, and we also all probably know that we don't take advantage of them as much as we should. It turns out, this error is quite a bit easier to debug if you know this trick.
Open your devtools on the broken page and navigate to the "Sources" tab. Here, you will want to expand the section called "Breakpoints" and add one for "Pause on uncaught exceptions". This will halt all execution of JS when the rendering error occurs. Reload the page, and hopefully your browser will halt.
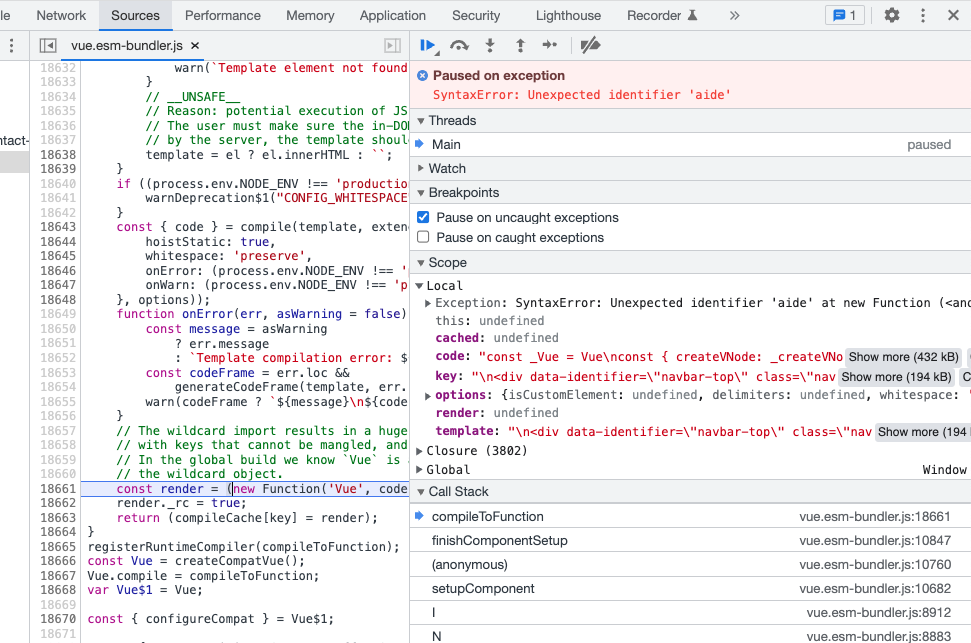
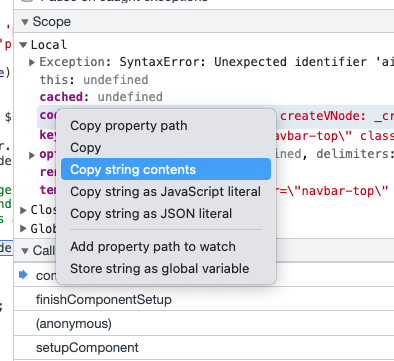
Now we're getting somewhere! Here we can see the same console error from before, but we can also access some variables in the scope of the failure. At first glance, these don't seem super relevant. But, thankfully, we can export the content of these variables and inspect them closer in a more suitable environment. In our case, we'll copy the value of the code object property and paste it into VS Code.
What we've just copied is a ton of code! Depending on the size of your Vue application, this could be bigger or smaller, but in my case, this is essentially an entire webpage worth of HTML rendering. When Vue is about to render the page, it essentially needs to run eval() on a big string of HTML and Vue syntax. This is what we have copied into our IDE from the devtools.
In my case, VS Code automatically detected that I was pasting JS into a blank file and automatically syntax highlighted for me. This means, I also can see the error, directly in VS Code's JS parser!
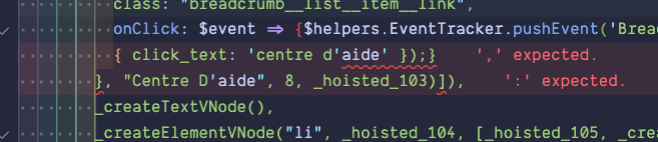
You can ignore the second red-squiggly, but now it is easy to see exactly what is happening!
In our case, we have a custom click handler being registered with dynamic data for a specified callback. In this case, we were passing a string that included a single-quote inside of a larger quoted string.
Here is a simplified example from our backend Laravel Blade template illustrating the problem.
// example.blade.php

@var $dynamicData = "checkin' out errors"

// This has access to the global Vue mounted scope for methods.
<button @click="trackEvent('{{ $dynamicData }}')">
  Click me!
</button>
Now the issue is obvious. We have an "unescaped" string trying to be parsed by Vue when the site renders.
Since @click accepts a JS expression, if we do not correctly escape all of our strings correctly, Vue could error out because trackEvent('checkin' out errors') is not a valid JavaScript expression.
Depending on your backend framework, escaping quotes is different but generally a very simple process. In PHP, you can use something like the addslashes() function included in the stdlib.
Conclusion
While it's never fun to have applications break in production with no way to reliably reproduce the error locally, this can be a useful reminder of our powerful our devtools are and why we should learn to use as many features as possible, rather than only treat it as "View Source" on steroids.
Hopefully this helped you discover the root of a nasty bug in your app and gave you the knowledge to fix and avoid it in the future.
Send me a tweet or toot me on Mastodon if this blog post helped you! I don't run analytics on this site anymore because I'm a cheap bastard. 😁